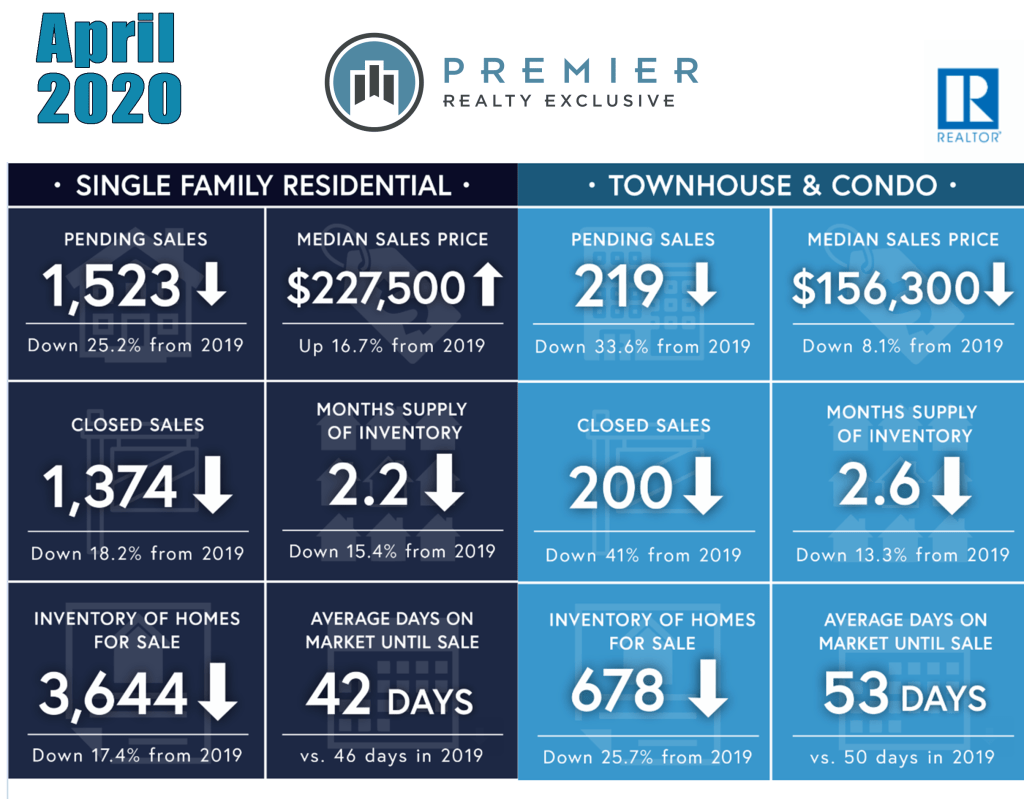
To understand supply vs. demand in the housing market, the important number to remember is 6. That’s the number of months’ supply of available homes on the market. That’s what we call equilibrium. Back in 2020, we were looking at a 2-3 month supply. We were in a housing shortage then, but its getting worse each year.
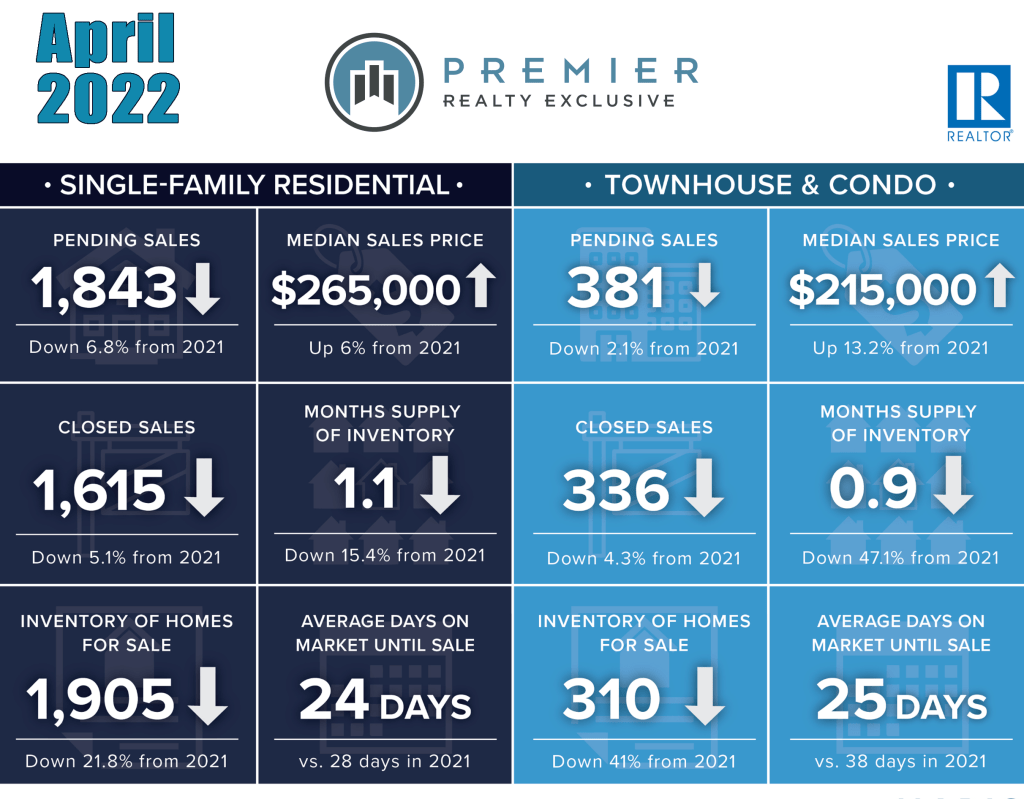
In looking at the April 2022 Market Report for St. Louis City & County, the need to see April 2021 and April 2020 reports was clear.
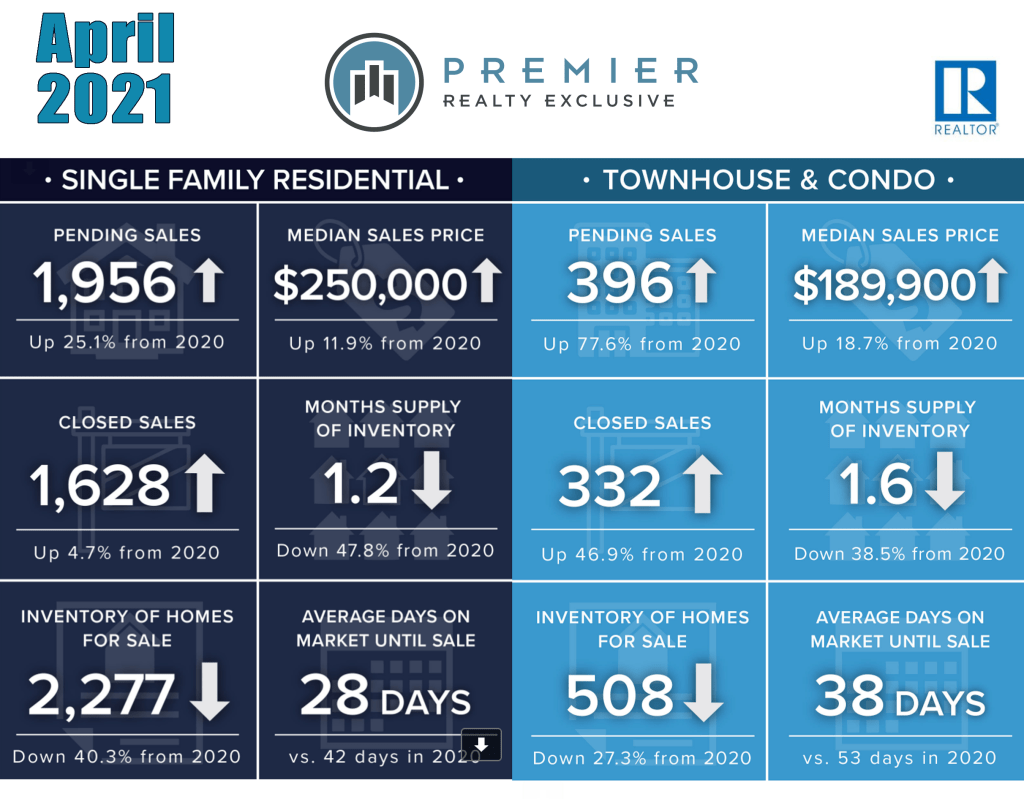
The numbers are telling.
- Inventory continues to drop
- Homes are selling faster.
- Prices are getting higher.
We could go back further and the 2019 numbers (which are partially available at the bottom of 2020’s summary), but the trend we’re seeing started around 2014.
This year, we have seen an increase in the homes available in May, but it will take even more homes hitting the market to satisfy the need for homes. With interest rates rising, it’s likely that home values will stop escalating as much as they have been, but its clear that demand for homes will continue to keep sales and prices up!
